
 close
close


 LOGIN
LOGINYou are viewing 1 of your 1 free articles. For unlimited access take a risk-free trial
Training zones: why your ACTUAL maximum heart rate matters!
SPB looks at new research on the common maximum heart rate formulas used to determine training zones, and explains why your training zone targets may have been incorrect all along



A successful training program involves knowing how hard to train and how to vary your training intensity. For example, to improve your ability to sustain a maximal effort, you need train in the zone at or near your maximum sustainable aerobic threshold (or lactate threshold) boundary – ie a very hard but not maximal effort. It follows then that understanding the concept of training zones (see this article) is vital for maximising your performance. To understand how to use the training zone concept, you need to know where the zone boundaries lie, which zone you’re in and when you cross from one zone to another. Basically, if you don’t understand training zones, your training sessions become nothing more than guesswork!
The role of heart rate monitoring
Unfortunately, because of the overlap in energy systems, the boundaries between training zones aren’t always easy to determine – especially for less experienced athletes. In particular, the lactate and aerobic energy systems have a large degree of overlap (see figure 1). The good news is that there are a number of ways to determine what zone you’re in, the most widely used being heart rate monitoring. Unlike power meters, or speedometers, a measure of your heart rate gives you an indication of your internal work rate, so can be used by any athlete in any sport at any time. Moreover, if you know your maximum heart rate (MHR), you can use it to set training zones based on a percentage of your MHR.
Figure 1: Schematic representation of contribution over time of the body’s energy systems
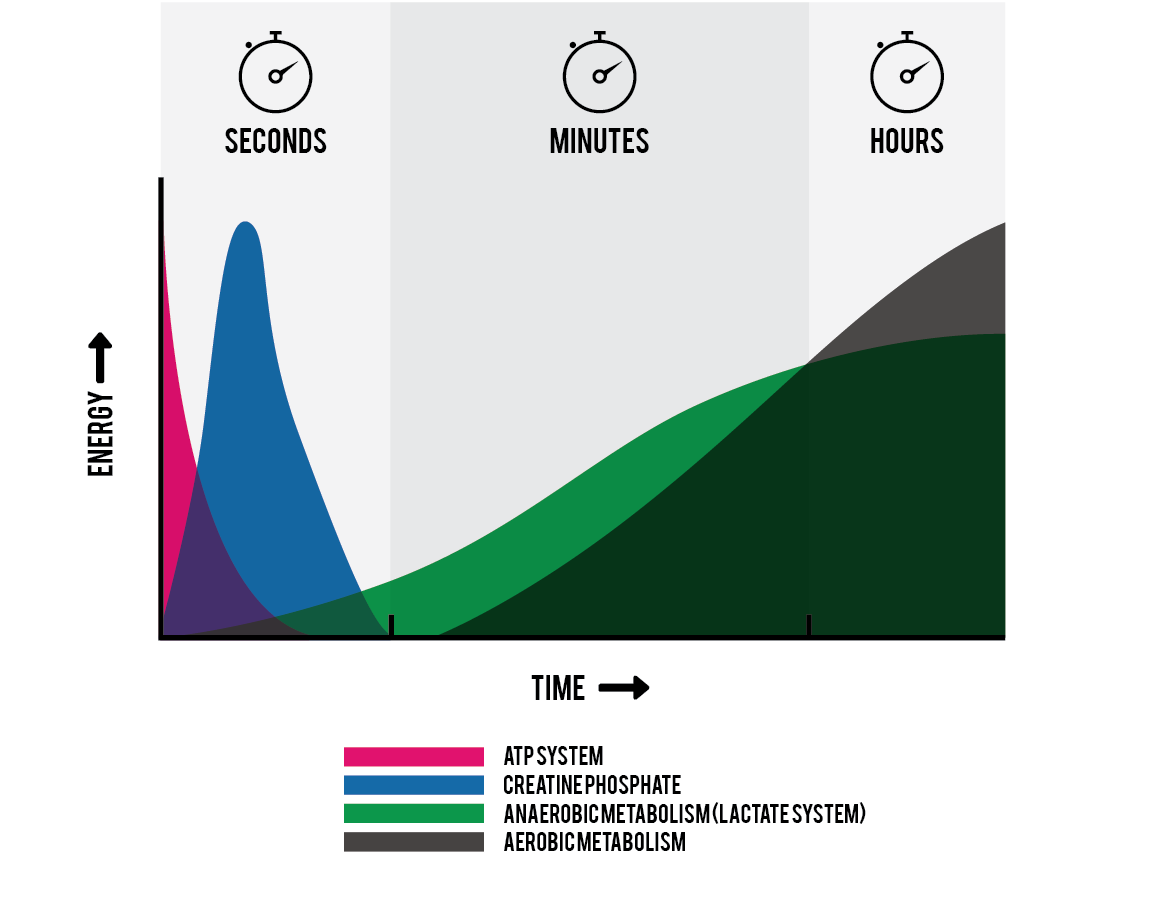
Pink = ATP system; blue = CP system; green = lactate system; black = aerobic system. Notice the large overlap between the lactate and aerobic energy systems. This makes it much harder for athletes to determine the zone boundary when training near lactate threshold.
Heart rate zone determination
The traditional gold standard for determining actual maximum heart rate is to perform a graded test to exhaustion – ie by working harder and harder until you can no longer keep going and seeing what your heart rate at that point is. However, this method of determining MHR can be very demanding and quite unpleasant to perform, and even then it’s not foolproof! Also, it’s most definitely NOT recommended for anyone who is not already extremely fit because of the (very small) risk of a cardiac arrest. MHR tests can be carried out on older, less fit individuals, but they need to be done under medical supervision. This explains why heart rate formulas and predictions of MHR are widely used to establish training zones (see table 1 for zone examples).
Table 1: Lactate and heart rates in zone training
Related Files

This basic zone chart (some zone charts may consist of 5 or 6 zones) shows the relationship between the types of training zones and the lactate or heart rate boundaries of those zone. Since lactate monitoring in real time is very tricky, heart rate is much more commonly used to determine intensity.
The problem with heart rate formulas
Although using heart rate as a way of determining intensity/training zones is well accepted by athletes and coaches, many are unaware that the heart rate formulas that form the basis of the exercise prescription are at best approximations. This is because an estimation of maximum heart rate – essential for determining percentages of workload - using a general formula can never be as accurate as an individual ramp test to exhaustion in the lab. For example, the commonly used MHR calculated as ‘220 – your age in years’ developed by Fox et al. way back in 1971 is a huge approximation because it was derived small groups of sedentary people rather than fit or athletic individuals(1).
Other MHR formulas also come with caveats. The Tanaka formula developed in 2001 created a slightly more complex rule: MHR = 208 - (0.7 x age in years)(2). However, while it was more accurate for older people, it still didn’t account for how ‘fit’ someone is. Meanwhile the ‘HUNT Fitness Study’ derived the equation for MHR as: 211 – (0.64 × age)(3). But while that formula works well when averaged over a very large group of people, it showed a large degree of variability at the individual level, especially for athletes. Indeed, research has shown that even if an athlete is tested to exhaustion on a treadmill to determine maximum heart rate and oxygen uptake (VO2max), the figure derived is likely to underestimate the true MHR by approximately 5–6bpm(4).
In short, prediction errors of 10 - 15bpm when using MHR in training prescription formulas are actually quite common, which can significantly affect the actual training intensity zone targeted. For example, a 5 - 6bpm underestimation may shift an athlete from the intended threshold zone (80–87% HRmax) into the lower-intensity training ranges. In fact, a study last year looking at age-based maximal heart rate equations across a range of fitness levels found that recommended training heart rates could be out by as much as 20bpm – the difference between an ‘easy’ recovery session or a really hard threshold session(5)! It’s likely that a large component in the MHR calculation errors arises from older athletes; your heart rate drops as you get older, but it drops differently depending on which sport you do and how fit you are(6) – something that the formula calculations struggle to account for.
The real MHR
Given that all of the formulas used to calculate MHR – which then gets fed into training zone calculations – are inaccurate in various ways, and that even a lab test might not accurately yield MHR in a trained athlete, how can we find out more about what the actual MHR is likely to be in athletes in real-world conditions? That’s what a team of Norwegian scientists set out to in a new study published last month in the journal ‘Frontiers in Sport and Active Living’(7). The goal of the study was to investigate real-world data on maximum heart rates from athletes’ smart watches and heart rate monitors to see how it compared to the predictive formulas that are commonly used.
To carry out this study, the researchers looked at a massive amount of data from 4,375 endurance athletes gathered between November 2022 and January 2023. The athletes’ backgrounds and numbers from each sport were as follows:
· Road cycling 1,836
· Running 1,194
· Triathlon 645
· Rowing 302
· Cross-country skiing 268
· Swimming 22
· Other sports 109 (mostly kayaking, biathlon and trail running/cycling)
The athletes were mostly of European and North American backgrounds, but there was also data from African, Asian and Oceanian athletes. Specifically, the researchers asked these athletes to report their highest ever heart rate recorded during training or racing, and they also collected data on the athletes’ resting heart rates and training habits.
By gathering and analyzing a large amount of data from all over the world across many sports, the researchers were able to arrive at more robust conclusions that were not sport- or genetics-dependent. When this ‘real-world’ data from the athletes was analyzed, the researchers compared their findings to the MHR numbers predicted by the Fox and Tanaka formulas. They also compared the athlete-reported data to laboratory treadmill testing data, which is often considered the gold standard for evaluating MHR. In addition, sub analyses were carried out to see how well (or badly) these formulas held up across different age ranges and the athlete’s training status.
What they found
Once the data from all the athletes had been analyses, three key findings emerged:
1. Underestimation of MHR - The ACTUAL maximum heart rates recorded by the athletes training and racing in real-world conditions confirmed that the Fox (220 minus age) and the Tanaka equations 208 - (0.7 x age in years) almost always estimate MHR too low for trained athletes (see figure 2). On average, these formulas were underestimating MHR by some 5 to 6 beats compared to the heart rates the athletes were actually achieving. Worse still, these formulas struggled with individual variability, which meant for some athletes, they estimated MHRs with huge errors – over 20bpm error in some cases. In short, this data provided rock solid evidence that serious athletes cannot rely on a simple mathematical formula to predict MHR.
2. Laboratory testing errors – The assumption that laboratory testing is the gold standard and highly accurate for assessing MHR was shown to be erroneous. While it was found to be superior to the use of a simple formula, the data showed that athletes often achieved higher heart rates during racing than during lab testing. The most likely explanation for this is sheer motivation; chasing down an opponent or surging for the finish line is going to evoke a lot more motivation to push yourself to the absolute limit than running on a treadmill with gas-analysis tubes in your mouth – even if the technician is spurring you on!
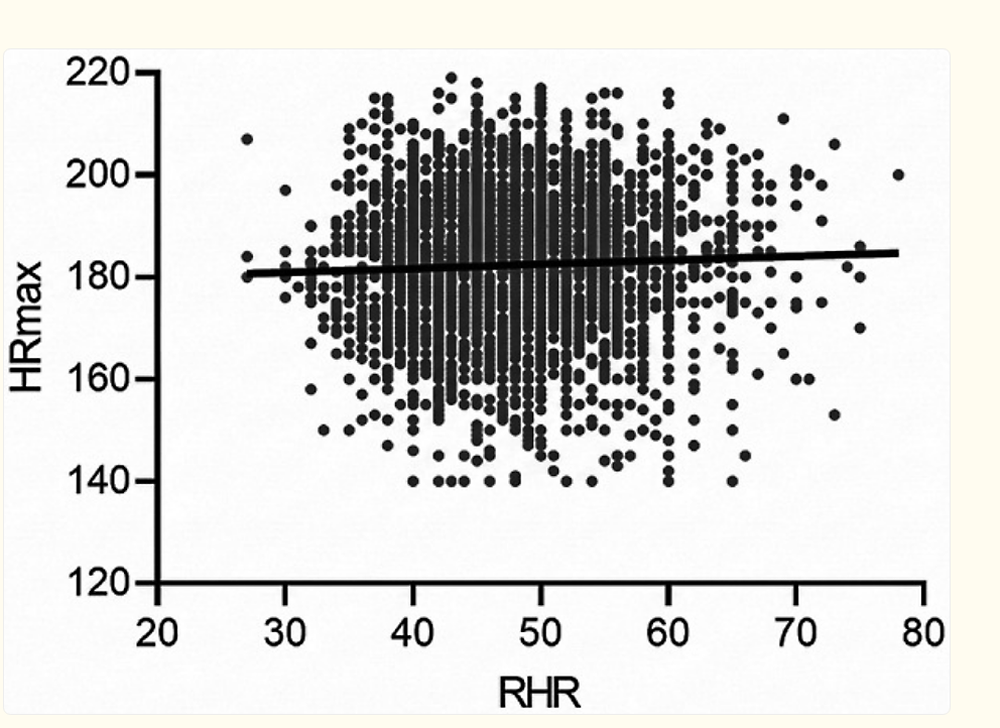
3. Age and MHR – There was a strong negative correlation between age and MHR – ie a lower MHR with increasing age. However, this age-related decline was much less in the athletes than predicted by the formulas. For example, the Fox formula (220-age) predicts an MHR of 160bpm for a 60-year old whereas actual data showed it was around 190bpm! This finding provides a good illustration of how maintaining high levels of fitness slows the rate of biological aging typically observed in the sedentary population. The data also showed that the association between MHR and resting heart rate (RHR) was negligible – ie resting heart rates do not necessarily decrease in line with age-related MHR decreases (see figure 3).
Figure 2: Actual MHR deviations from formula predictions
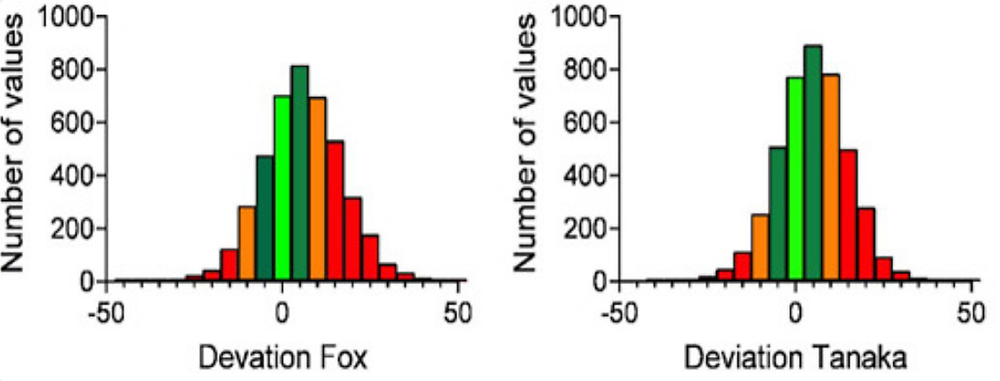
The bottom scales show how many beats per minute (bpm) error in the formula predictions. An entirely accurate formula would have all the athletes shown as one big green bar centered on zero (error). In reality, many athletes had an MHR that was at least 5bpm higher than the prediction – some even had an MHR 30 beats higher than predicted! To a lesser extent, these formulas failed the other way too, with athletes having actual MHRs lower than predicted, thus illustrating huge variability.
Figure 3: Relationship between resting heart rate (RHR) and MHR
Practical advice for athletes
This important piece of research provides powerful real-world evidence that for trained athletes, the formula-derived estimates of MHR (which are then used to determine training zones) are even more flawed and unreliable than previously thought. If you’re a 40-year old athlete with a predicted MHR of 180bpm, there’s every chance your real MHR could be 185bpm or higher – possibly even over 200bpm! That’s because apart from the inherent inaccuracies of these formulas in all populations, consistent training over years and decades makes athletes a very different species. If that athlete sets his/her zones based on the 180bpm prediction, they will likely be training at a significantly lower intensity than that targeted.
The first tip therefore is not to rely on a simplified formula to predict your MHR. Instead, look back through your own heart rate data from the past 12 months. Find your hardest race or your most difficult interval session and note the highest number you saw. So long as you are using a reliable heart rate monitor that uses a chest strap and that highest number didn’t appear as a sudden peak out of the blue (which would indicate a glitch), it is likely that it will be your real MHR. If you don’t have that recorded data to analyze, you need to begin taking logs, and recording data from your hardest training sessions – or even better races. Just doing this for two to three months will likely give you a better handle on your real MHR compared to using a formula-derived figure.
Another recommendation is to consider adopting the approach used by the Karvonen formula (albeit slightly modified)(8). This is a different way of calculating your training heart rate zones based not on a percentage of your absolute maximum heart rate, but on your heart rate reserve (HRR) – ie the amount of capacity your heart has to do work above and beyond its resting work rate. Your HRR is given as the difference between resting heart rate and maximum heart rate. Note however that you should obtain using a real-world measurement of your MHR rather than from the 220-age formula that is generally suggested.
For example, an athlete with a maximum heart rate of 195bpm and a resting heart rate of 55bpm has a heart rate reserve of 140bpm. If your goal is to train at 80% max using your HRR, you simply find 80% of your HRR (80% of 140 = 112bpm) then add that %HRR onto your resting heart rate – in this case 112 + 55 = 167bpm. Although it’s slightly more complex to apply, the Karvonen formula more accurately reflects the working % of your maximum oxygen uptake than does a simple % of MHR calculation, particularly for athletes in training. A final tip is to ensure you measure your resting heart rate accurately. Be sure to measure it first thing in the morning (before tea/coffee) while relaxed and lying down or seated. Take a few measurements over a few days and then average the results.
References
1. Ann Clin Res. (1971) 3(6):404–432
2. J Am Coll Cardiol. (2001) 37(1):153–156
3. Scand J Med Sci Sports. (2013) 23(6):697–704
4. Scand J Med Sci Sports. (1991) 1(3):134–140
5. PLoS One. (2025) 20(10):e0335842
6. Res Q Exerc Sport. (1982) 53(4):297–304
7. Front Sports Act Living. 2026 Apr 20;8:1806303
8. Annales Medicinae Experimentalis et Biologiae Fenniae 1957. 35(3), 307–315

Andrew Hamilton

Latest Issue

Subscribe Today

Newsletter Sign Up
Testimonials
Dr. Alexandra Fandetti-Robin, Back & Body Chiropractic
Elspeth Cowell MSCh DpodM SRCh HCPC reg
William Hunter, Nuffield Health
Editor's Picks
Subscribe Today




Newsletter Sign Up

Coaches Testimonials
Dr. Alexandra Fandetti-Robin, Back & Body Chiropractic
Elspeth Cowell MSCh DpodM SRCh HCPC reg
William Hunter, Nuffield Health
Subscribe Today
Latest Issue


Keep up with latest sports science research and apply it to maximize performance
Today you have the chance to join a group of athletes, and sports coaches/trainers who all have something special in common...
They use the latest research to improve performance for themselves and their clients - both athletes and sports teams - with help from global specialists in the fields of sports science, sports medicine and sports psychology.
They do this by reading Sports Performance Bulletin, an easy-to-digest but serious-minded journal dedicated to high performance sports. SPB offers a wealth of information and insight into the latest research, in an easily-accessible and understood format, along with a wealth of practical recommendations.
*includes 3 coaching manuals
Get Inspired
All the latest techniques and approaches


Sports Performance Bulletin helps dedicated endurance athletes improve their performance. Sense-checking the latest sports science research, and sourcing evidence and case studies to support findings, Sports Performance Bulletin turns proven insights into easily digestible practical advice. Supporting athletes, coaches and professionals who wish to ensure their guidance and programmes are kept right up to date and based on credible science.
